Smart GIS Software
Developed by Smart GIS Company
Mohamed Elsayed Elshayal
Salsabeel Mohamed Elshayal and Yaseen Mohamed Elshayal
1) Map editor, 2) Surface analysis,
3) GPS tracking, 4) Downloading Google map,
5) Converting GIS shape files to Google map web GIS and mobile GIS GPS applications
First African Arabian Egyptian GIS and GPS Software
Cairo – Egypt
2002 - 2019
Copyright 2002 – 2019
Free for noncommercial use
This Software is Independent of any Commercial Software Package, or Code Library
This Software is built by Smart GIS company and Not Supported by any Organization
Smart GIS Course Syllabus
1) INTRODUCTION
A) Q. What is a Geographic Information System?
B) The Difference between Raster and Vector Maps
C) The Relation between Vector Spatial Location and Attribute Data Base
D) GIS Shape File types 2D & 3D (Point – Polyline – Polygon)
2) COORDINATES SYSTEMS
A) Lon and Lat Geographic Coordinate System
B) Universal Transverse Mercator Coordinate System UTM
C) Converting Coordinates Between Lon Lat and UTM
D) Map Projection
3) SPATIAL DIGITIZING AND EDITING
A) Building New Shape File Spatial and Data Structure
B) Digitizing Spatial Shape File ( Feature – Part – Vertex )
C) Editing Shape File ( Feature – Part – Vertex )
D) Move Settings
E) Map View
F) Converting between Shape File types 2D & 3D (Point – Polyline – Polygon)
G) Layer Properties
4) ATTRIBUTE DATA TABLE
A) Modifying Dbf File Data Structure
B) Editing Data Table
C) Running VB script in Data Table Fields
D) Editing One Feature (Record)
5) GIS ANALYSIS AND SELECTION
A) Spatial Location Analysis and Selection
B) Attribute Data Base Analysis and Selection
C) Nested Attribute Data Base Analysis and Selection
D) Spatial Features Snapping and Dividing
E) Shortest Path Analysis
6) SATELLITES IMAGES
A) Google Earth Settings
B) Download From Google Earth
C) Save Images
7) SURFACE ANALYSIS
A) Downloading (ASTER and SRTM) NASA Geo DEM Height Files
B) Convert (ASTER and SRTM) NASA Geo DEM Height Files to Tin Shape File
C) Convert ASTER NASA Geo DEM to Color value bmp File
D) Building Contours from ASTER NASA Geo DEM
E) Building Tin Surface Analysis
F) Building Contours Surface(s) Analysis
G) Converting 2D to 3D Surface Analysis
H) Calculating Area and Volume of Surface(s)
8) GIS MISALLIANCE TOOLS
A) Converting AutoCAD files to GIS Shape Files
B) Converting GIS Shape Files to AutoCAD files
C) Converting GIS Shape Files to Google KML files
D) Converting GIS Shape Files to HTML GIS Web Sites
E) Synchronize Google Earth with Lon Lat Geographic maps
9) TRAINING ( BUILDING A GIS PROJECT )
A) Determine a Specific Small Working Area or City
B) Downloading Satellite Images of the Working Area
C) Building Roads and Building shape Files Layers
D) Digitizing the Working Area Roads and Building layers
E) Entering the Available Attribute Data of the Digitized Layers
F) Spatial and Attribute Data Analysis of the Digitized Layers
G) Downloading ASTER DEM NASA Height File of the Working Area
H) Surface Analysis of the Working Area
I) Converting Digitized GIS Layers to AutoCAD.
J) Save Images of the Produced Map (Project Gallery)
K) Converting Digitized GIS Layers to HTML Google Map Web Site.
1) Introduction
A) Q. What is a Geographic Information System?
A. Geographic Information System (GIS) is a computer program for storing, retrieving, analyzing, and displaying cartographic data.
Vector Spatial Location Data = X, Y, Z
Attribute Data Base = Data Information
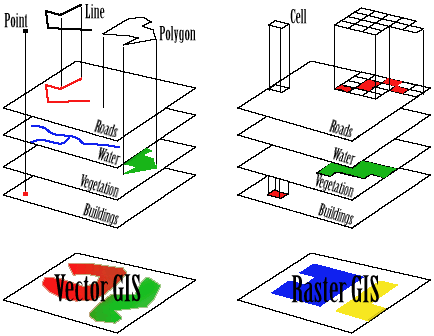
B) The Difference between Raster and Vector Maps
Maps in Geographic Information Systems are represented thematically. A standard topographic map will show roads, rivers, contour elevations, vegetation, human settlement patterns and other features on a single map sheet. In a GIS these features are categorized separately and stored in different map themes or overlays. For example, roads will be stored in a separate overlay. Likewise, rivers and streams will each be stored as a separate theme. This way of organizing data in the GIS makes maps much more flexible to use since these themes can be combined in any manner that is useful. The following illustration shows conceptually how maps are stored as themes in a GIS.
Each different theme is stored on a separate overlay. The overlays on the left represent a vector based GIS, where the information is stored as a series of points, lines and polygons. The overlays on the right represent a raster based GIS, where the information is stored as a series of discrete units called cells.
C) The Relation between Vector Spatial Location and Attribute Data Base
Each Spatial Layer is consist of many Spatial features
Each Spatial Feature consist of many vertexes (x, y, z)
Each Spatial Layer is related to one Attribute Data Base Table
Each Spatial Feature is related to one Attribute Data Base Record
Each Record consist of many fields (up to 255)
D) GIS Shape File types 2D & 3D (Point – Polyline – Polygon)
Shp file contain spatial Location data of each feature Which are:-
Type 2D & 3D (Point – Polyline – Polygon)
Number of Parts
Number of Vertexes
X,Y, and Z of each vertex
Dbf file contain Attribute Data
Shx file is a relation file between the Shp file and Dbf fie
Point Layer consist of one vertex per Feature(x, y, z)
Polyline Layer consist of many vertexes per Feature
Polygon Layer consist of many vertexes per Feature and closed
2) Coordinates Systems
A) Lon and Lat Geographic Coordinate System
The geographic latitude (abbreviation: Lat., or phi) of a point on the Earth's surface is the angle between the equatorial plane and a line that passes through that point
The North Pole is 90° N; the south pole is 90° S. The 0° parallel of latitude is designated the equator, the fundamental plane of all geographic coordinate systems. The equator divides the globe into Northern and Southern Hemispheres.
The Longitude (abbreviation: Long., or lambda) of a point on the Earth's surface is the angle east or west from a reference meridian to another meridian that passes through that point.
All meridians are halves of great ellipses (often improperly called great circles), which converge at the north and south poles.
B) Universal Transverse Mercator Coordinate System UTM
The UTM system divides the surface of Earth between 80°S and 84°N latitude into 60 zones, each 6° of longitude in width and centered over a meridian of longitude. Zone 1 is bounded by longitude 180° to 174° W and is centered on the 177th West meridian. Zone numbering increases in an easterly direction.
Each of the 60 longitude zones in the UTM system is based on a transverse Mercator projection, which is capable of mapping a region of large north-south extent with a low amount of distortion. By using narrow zones of 6° (up to 800 km) in width, and reducing the scale factor along the central meridian by only 0.0004 to 0.9996 (a reduction of 1:2500), the amount of distortion is held below 1 part in 1,000 inside each zone. Distortion of scale increases to 1.0010 at the outer zone boundaries along the equator.
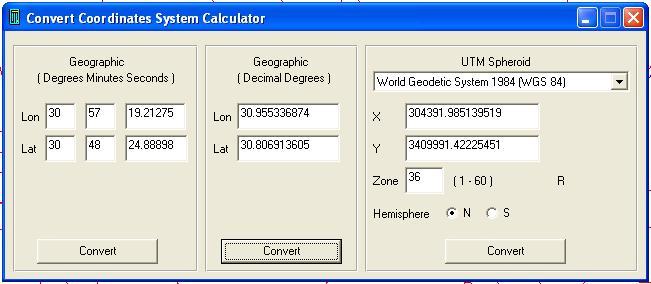
C) Converting Coordinates Between Lon Lat and UTM
Converting Coordinates System Calculator
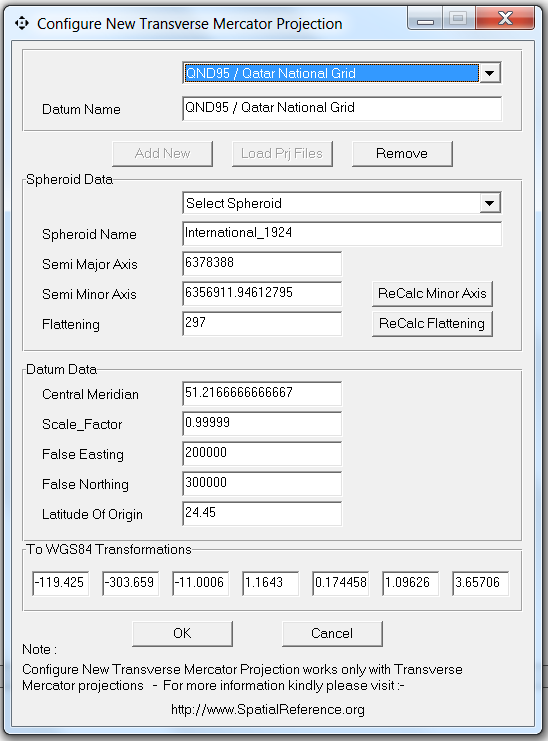
D) Map Projection
Configuring new Projection System
Menu → Tools → Configure New Projection System
Load Projection File
Add
Remove
Predefined Spheroid
AA Airy 1930
AN Australian National
BR Bessel 1841 Ethiopia Indonesia Japan Korea
BN Bessel 1841 Nambia
CC Clarke 1866 (NAD 1927)
CD Clarke 1880
EB Everest Brunei & E. Malasia (Sabah & Sarawak)
EA Everest India 1830
EC Everest India 1956
EF Everest Pakistan
EE Everest W. Malasia and Singapore 1948
ED Everest W. Malasia 1969
RF Geodetic Reference System 1980 (NAD 1983)
HE Helmert 1906
HO Hough 1960
ID Indonesian 1974
IN International 1924
KA Krassovsky 1940
AM Modified Airy
FA Modified Fischer 1960 (South Asia)
SA South American 1969
WD World Geodetic System 1972 (WGS 72)
WE World Geodetic System 1984 (WGS 84)

3) Spatial Digitizing and Editing
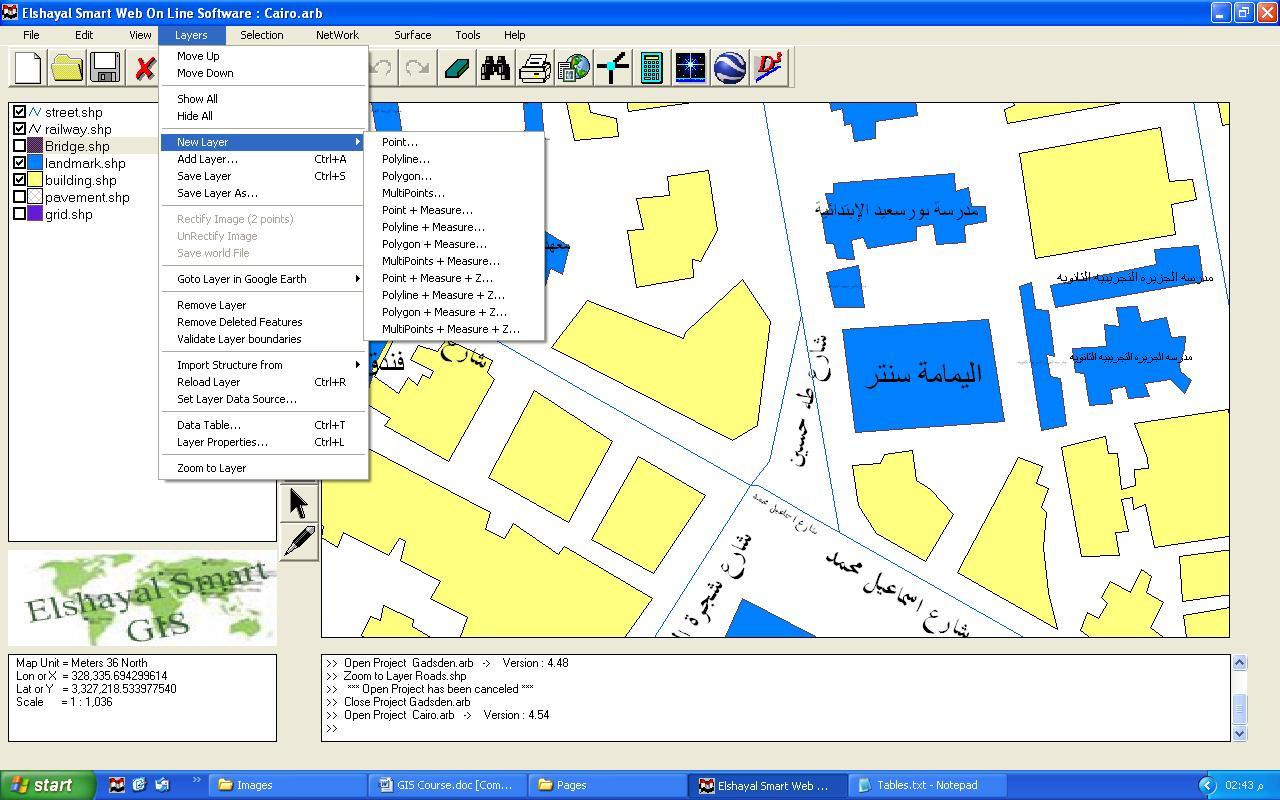
A) Building New Shape File Spatial and Data Structure
Building New Spatial Shape File
Menu → Layers → New Layer → Select Layer type
Move up, Moves the selected layer up
Move Down, moves the selected layer down
Show all Layers
Hide all Layers
New Layer, Build a new Layer
Add Layer, add an existing layer on the map viewer
Save Layer
Save Layer as, save the layer with different name
Rectify Image (2 points)
Un Rectify Image
Validate Layer boundaries
Go to Layer in Google Earth
Remove layer
Remove deleted features
Import structure from
Reload Layer
Set Layer Data Source
Data Table
Layer Properties
Zoom to Layer
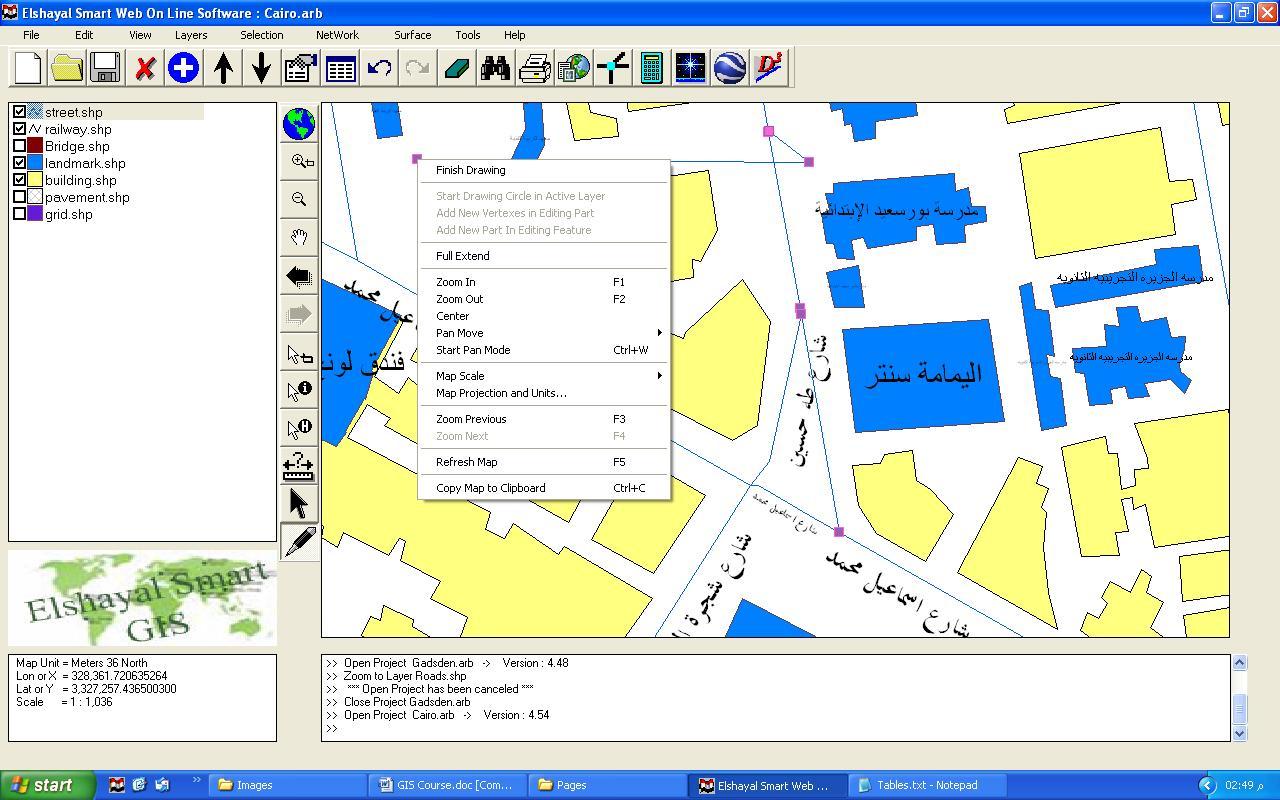
B) Digitizing Spatial Shape File ( Feature – Part – Vertex )
Digitizing Spatial Shape file
Buttons → Add New Feature → Start Digitizing
Finish Drawing
Start Drawing Circle in Active Layer
Add New Vertex in Editing Part
Add New Part in Editing Feature
Full extend
Zoom in
Zoom out
Center
Pan move
Start Pan mode
Map Scale
Map Projection and Unit
Zoom Previous
Zoom Next
Refresh map
Copy Map to Clipboard
C) Editing Shape File ( Feature – Part – Vertex )
Editing Spatial Shape file
Buttons → Edit Feature → Click cursor on the Feature → Right Click
Undo Drawing Map
Redo Drawing Map
Insert Vertex
Delete Vertex
Delete Part
Delete Feature
Divide Feature
Combine Feature
Edit Feature Data
Move Distance
Move to X , Y
Move Settings
Set Pivot Point
Rotate – Scale
Rotate – Scale menu
Go to Feature in Google Earth
Bring Part to Front
Send Part to Back
Invert part Direction
Add New Vertex in Editing Part
Add New Part in Editing Feature
Length
Area
Stop Edit
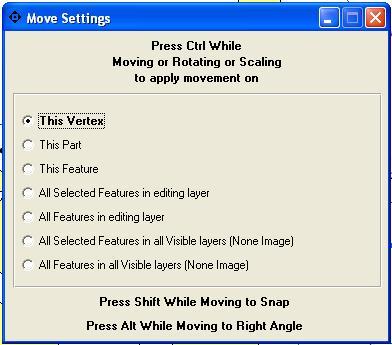
D) Move Settings
Editing Spatial Shape file
Menu → Layers → Move Settings
Press Ctrl while moving or Rotating or Scaling to apply movement on
This Vertex
This Part
This Feature
All Selected Features in Editing Layer
All Features in Editing Layer
All Selected Features in All Visible Layers (None Image)
All Features in All Visible Layers (None Images)
Press Shift while Moving to Snap or Press Alt while Moving to Right Angle
E) Map View

Menu → View
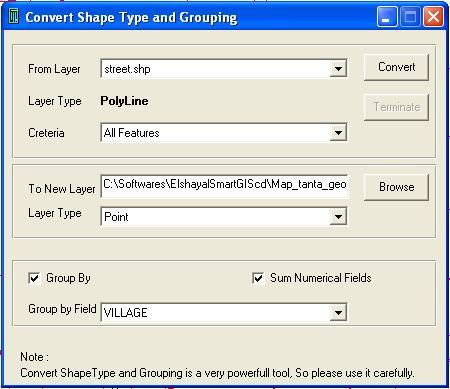
F) Converting between Shape File types 2D & 3D (Point – Polyline – Polygon)
Converting Shape Type and Grouping
Menu → Tools → Convert Shape Type and Grouping
Select Destination Layer
Select Criteria (All Feature or Inside Selected Features or Outside Selected Features)
Select Output Shape File
Select Output Shape File Type
Select Group By or Not
Select Summing Numerical Fields or Not
Select Group By Field
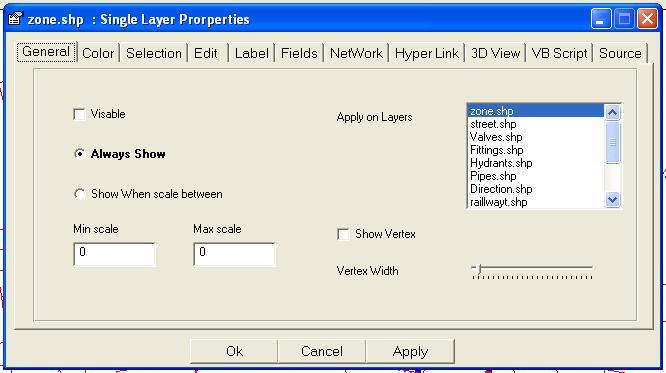
G) Layer Properties
Layer Properties General Option
Menu → Layers → Layer Properties → General
Select Visible or not
Select on which Layers, your selection will be applied
Select Show Vertex or Not
Select Vertex Width
Select Always show to view the layer all the time
Select Show When Scale between Min Scale and Max Scale
Layer Properties Color Option
Menu → Layers → Layer Properties → Color
Select Draw Fore Color and Draw Fill Color
Select Draw Mode
Select Draw Style
Select Draw Width
Select Draw Fill Style
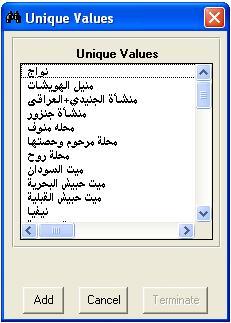
Select Thematic Field and add Values and select each Value Colors, Mode, Style
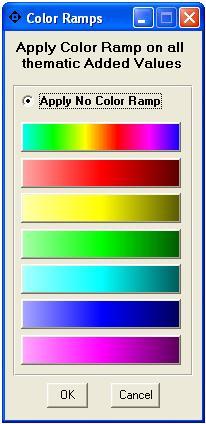
Select Apply Color Ramp to change colors of all added values
Layer Properties Color Option : Add Thematic Value
Menu → Layers → Layer Properties → Color → Add
Layer Properties Color Option : Apply Color Ramp on Added Value
Menu → Layers → Layer Properties → Color → Apply Color Ramp
Layer Properties Selection Option
Menu → Layers → Layer Properties → Selection
Select Selection Fore Color
Select Selection Fill Color
Select Selection Mode
Select Selection Style
Select Selection Width
Select Selection Fill Style
Select Selectable ( Snap to ) or Not
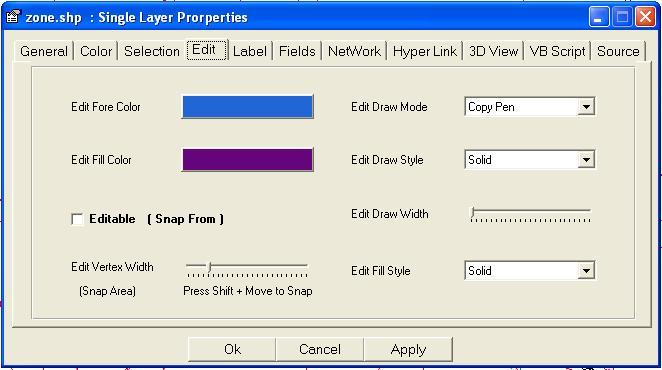
Layer Properties Edit Option
Menu → Layers → Layer Properties → Edit
Layer Properties Label Option
Menu → Layers → Layer Properties → Label
Select Show Label or Not
Select Label Field Name
Select Label Font
Select Label Fore Color
Select Always show to view the layer all the time
Select Show When Scale between Min Scale and Max Scale
Select Refer Label Font Size to this Map Scale
Select Force Label Size to Fit Polyline length and polygon width
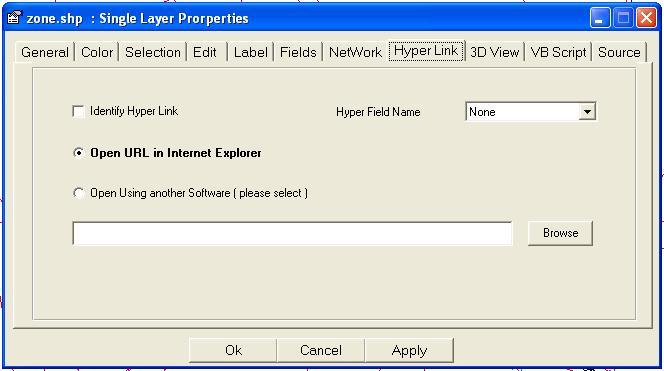
Layer Properties Hyperlink Option
Menu → Layers → Layer Properties → Label
Select Identify Hyperlink or Not
Select Hyperlink Field Name
Select Open URL in Internet Explorer
Select Open Using another Software (Please Select)
4) Attribute Data Table
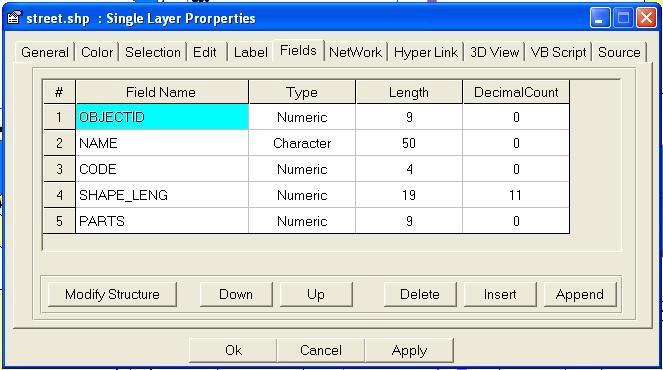
A) Modifying Dbf File Data Structure
Layer Properties Fields Option
Menu → Layers → Layer Properties → Fields
Press Append Button to add new field at end of fields list
Press Insert Button to add new field above of the selected Field
Press Delete Button to delete the selected field
Press Up Button to move Selected Field Up
Press Down Button to move Selected field Down
In the Field Name Columns, type a Unique Field Name
In the Type Columns, Select ( Character or Date or Logic or Numeric )
In the length Columns, Enter the field Length
In the Decimal Count Columns, Enter the number of Decimal digits
Press Modify Structure Button to apply the Field Modification
B) Editing Data Table
Editing Data Table
Menu → Layers → Data Table
Undo Data Edit
Redo Data Edit
Select Features
Unselect Features
Delete Features
Undelete Features
Edit Feature Data
Cut Cells
Copy Cells
Past Cells
Fill Past
Fill Series
Clear Cells
Sort Rows Ascending
Sort Rows Descending
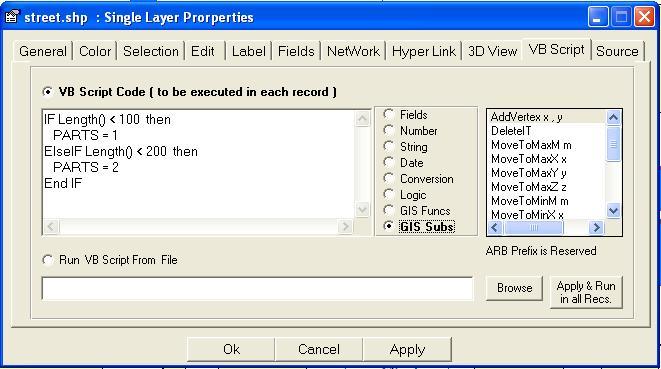
C) Running VB script in Data Table Fields
Layer Properties VB Script Option
Menu → Layers → Layer Properties → VB Script
Select Fields for Fields Name List
Select Number for VB Number Functions List
Select String for VB String Functions List
Select Date for VB Date Functions List
Select Conversion for VB Conversion Functions List
Select Logic for VB Logic Functions List
Select GIS Funcs for GIS Functions List
Select GIS Subs for GIS Procedures List
Press Apply & Run in All records
Note that "ARB" Prefix is Reserved
Select Run VB Script from File (to Load and Run External VB Script file)
D) Editing One Feature (Record)
Edit Feature
Menu → Edit → Edit Feature Data
5) GIS Analysis and Selection
A) Spatial Location Analysis and Selection
Selection Find and Data Transfer By Location (Query Builder)
Menu → Selection → Find and Data Transfer By Location (Query Builder)
Select Layer Name
Select Criteria (All Feature or Inside Selected Features or Outside Selected Features)
Select Method (New Selection or Add to Selection or Clear from Selection)
Select Relation
Select Relation to Layer
Select Apply Tolerance or not
Select Tolerance value
Select Apply Data Transfer for Similar Fields Name or not
Select Data Transfer Fields Names
Press Find to Start Searching
B) Attribute Data Base Analysis and Selection
Selection Find By Data (Query Builder)
Menu → Selection → Find By Data (Query Builder)
Select Layer Name
Select Criteria (All Feature or Inside Selected Features or Outside Selected Features)
Select Method (New Selection or Add to Selection or Clear from Selection)
Select Field from the Fields List
Select Relation from the Relation List
Press Update Unique Value to get all available values
Select Value from the List or write it
Select Match Case or not
Select Map Scale for viewing result
Press Find to Start Searching the selected value
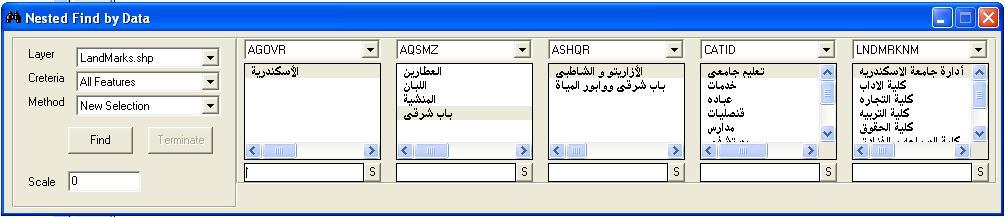
C) Nested Attribute Data Base Analysis and Selection
Nested Selection Find By Data (Query Builder)
Menu → Selection → Nested Find By Data (Query Builder)
Select Layer Name
Select Criteria (All Feature or Inside Selected Features or Outside Selected Features)
Select Method (New Selection or Add to Selection or Clear from Selection)
Select Fields from the Fields Lists
Select Values
Select Map Scale for viewing result
Press Find to Start Searching the selected values
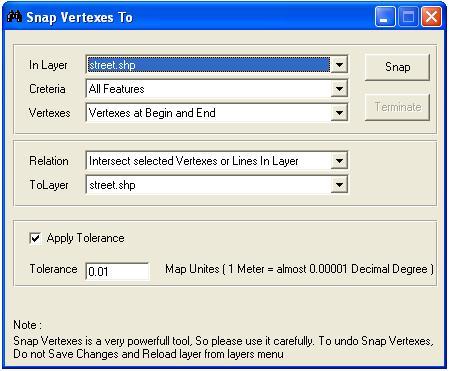
D) Spatial Features Snapping and Dividing
Network Snap Vertexes to
Menu → Network → Snap Vertexes to
Menu → Network → Divide Polylines or Polygon on
Select Layer Name
Select Criteria (All Feature or Inside Selected Features or Outside Selected Features)
Select Vertexes (All , OR (Begin & End) )
Select Relation
Select Relation to Layer
Select Apply Tolerance or not
Select Tolerance value
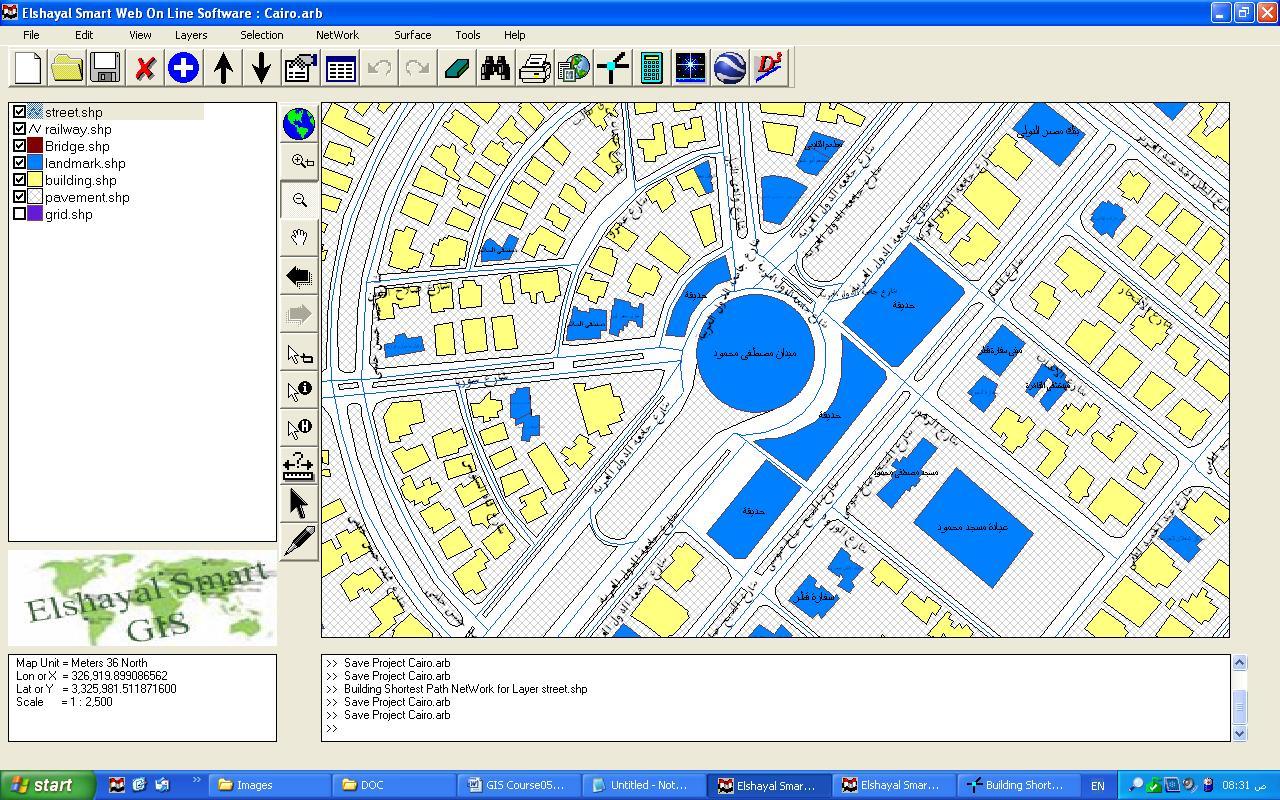
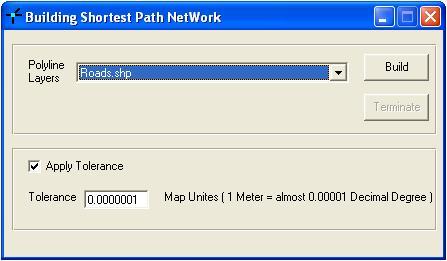
E) Shortest Path Analysis
Building Shortest Path Network
Menu → Network → Build Shortest Path Network
Shortest Path Network
Menu → Network → Shortest Path Network
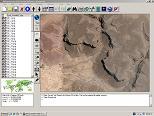
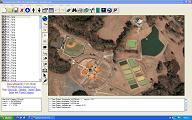
6) Satellites Images
A) Google Earth Settings
Open Google Earth 4.3 or Later Versions ( It must be installed in your Computer )
Inside Google Earth, do the following Settings
Tools → Options : Turn Off Terrain
Be Sure that North Arrow is completely very up by
Be Sure that Google Earth is very Flat by:
Close Google Earth
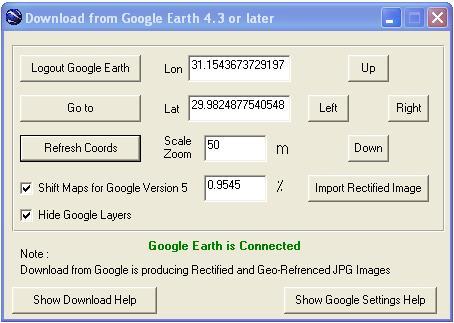
B) Download From Google Earth
Download From Google Earth
Menu → Tools → Download Form Google Earth
In GIS Software
Press Login Google Earth 4.3 or Later Versions ( It must be installed in your Computer )
Press Refresh Cords Button in GIS Software to get Google Earth Position
Enter Your Lon & Lat Cords' and Scale Zoom
Press Go to
Press Import Rectified Image (Will Capture B&W Google Earth Map)
In Google Earth Software
Press Save Image to overwrite the B&W Image File
In GIS Software
Reload Layer from Layers Menu to get colored rectified Image.
Use Up, Down, Right, Left Buttons to navigate
Press "Go to Layer in Google" in Layers Menu (to find layer area in Google)
Press "Go to Feature in Google" in Edit Manu (to find your area in Google)
Check Shift Maps, If your Google version is 5 or later
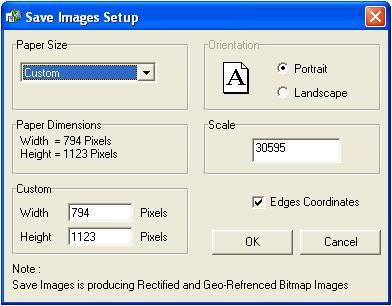
C) Save Images
Save Images Setup
Menu → Files → Save Images
This Function will produce
Bit map image BMP with Edges Coordinates
BPW World File format for BMP Image
JGW World file format For JPG image
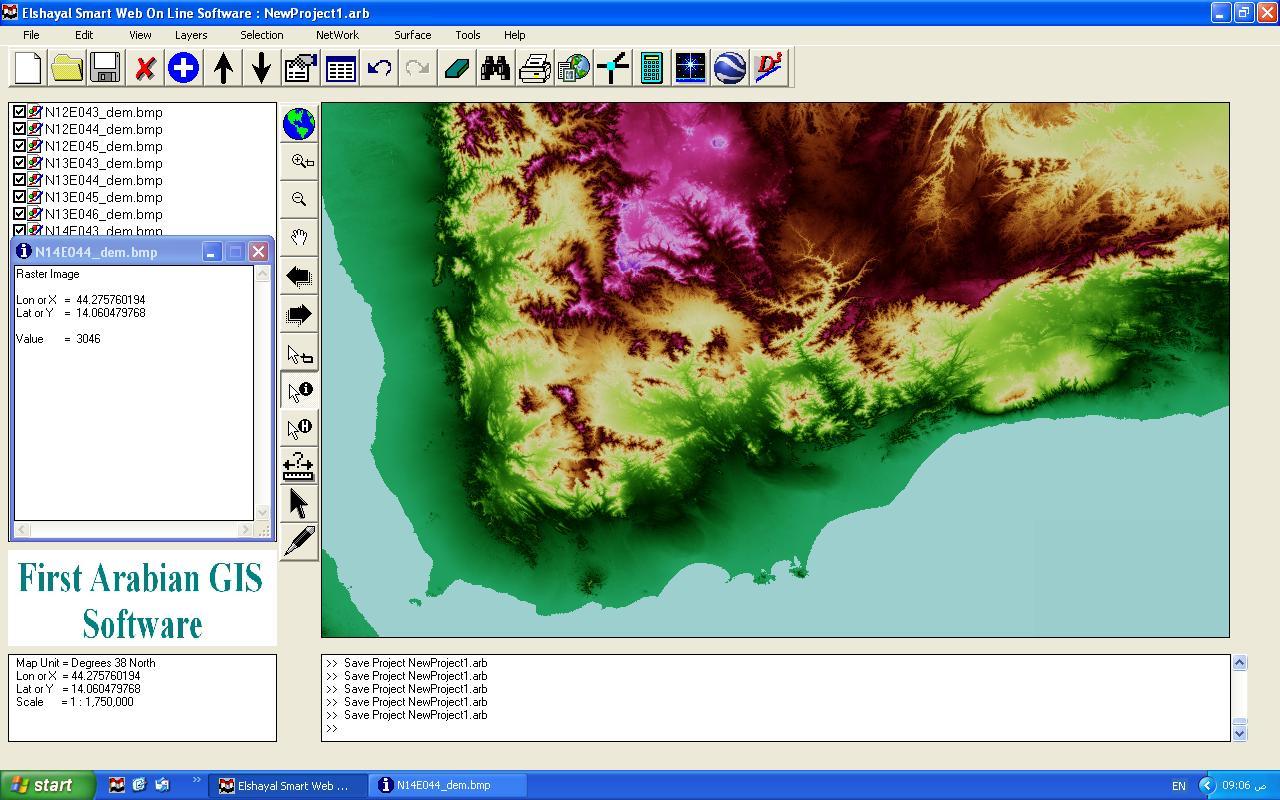
7) Surface Analysis
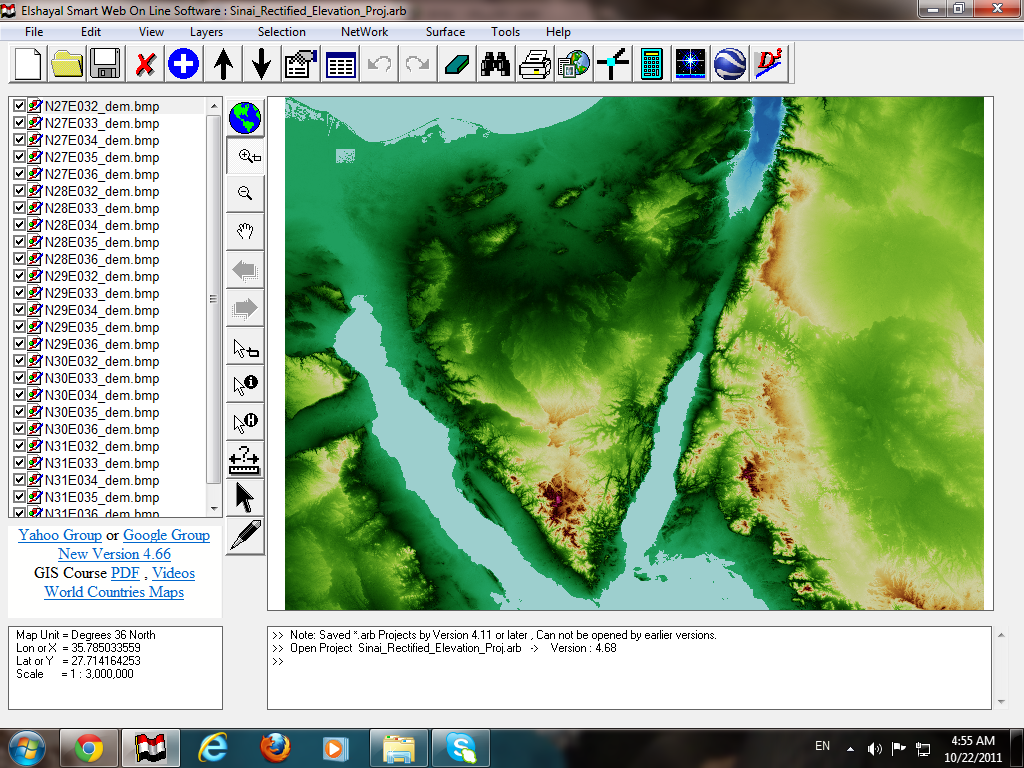
A) Downloading (ASTER and SRTM) NASA Geo DEM Height Files
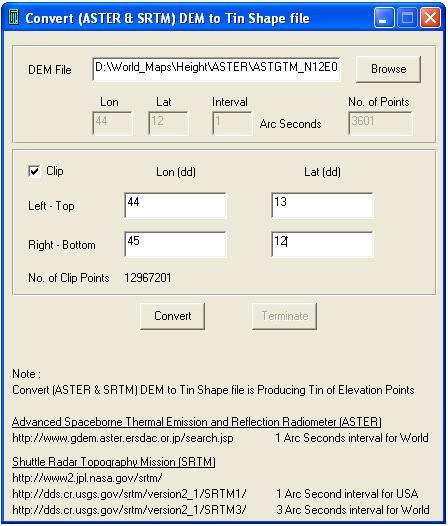
B) Convert (ASTER and SRTM) NASA Geo DEM Height Files to Tin Shape File
Convert (ASTER & SRTM) DEM to Tin Shape file
Menu → Tools → Convert (ASTER & SRTM) DEM to Tin Shape file
C) Convert ASTER NASA Geo DEM to Color value bmp File
Convert ASTER Geo DEM to Color Value bmp file
Menu → Layers → Add Layer → Files of Type → TIFF → Open
Menu → Layers → Save Layer as → Change the File extension to → BMP → Save
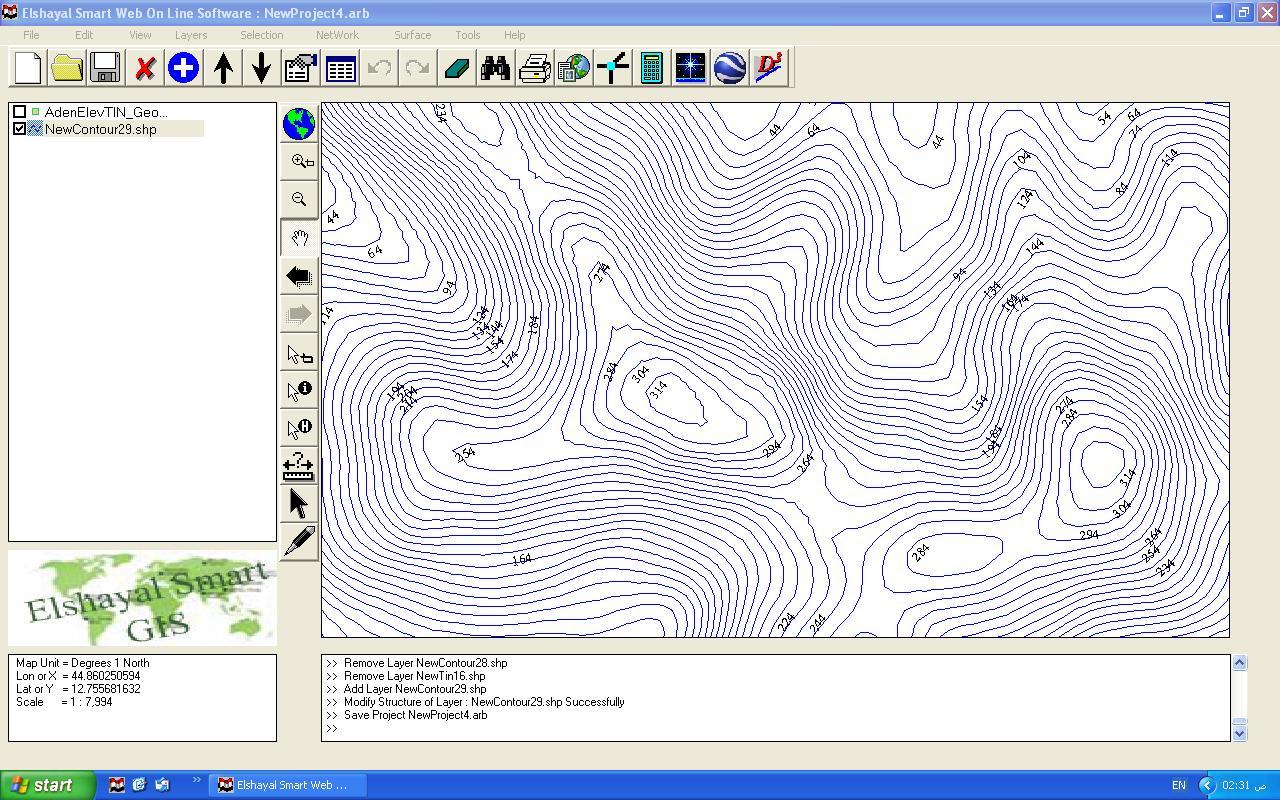
D) Building Contours from ASTER NASA Geo DEM
Menu → Surface → Building Contours Surface(s) Analysis
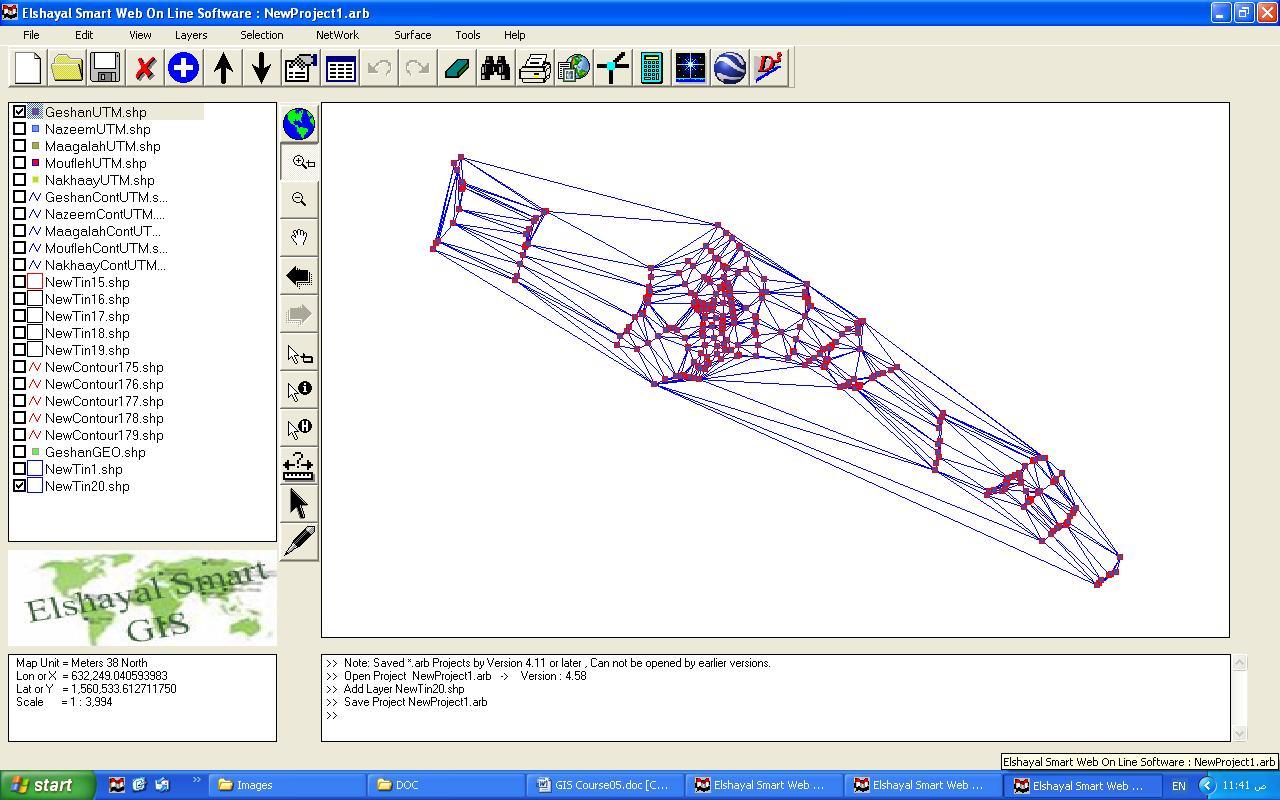
E) Building Tin Surface Analysis
Menu → Surface → Building Tin Surface(s) Analysis
Select Height Layer Name
Select Height Criteria (All Feature or Inside Selected Features or Outside Selected Features)
Select Height Field
Select Output Tin Surface Shape file name
Select Build Surface by Delaunay, if elevation points have unequal distances among them.
Select Build Surface by Matrix, if elevation points have equal distances among them.
Press Build
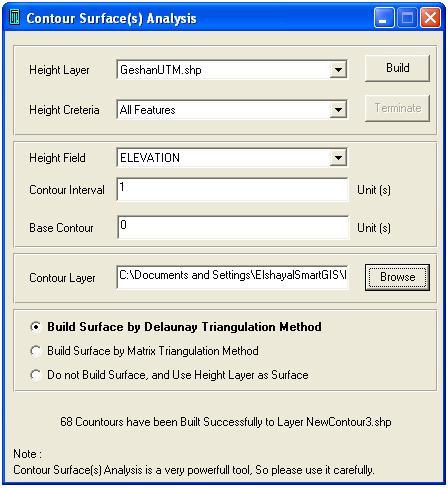
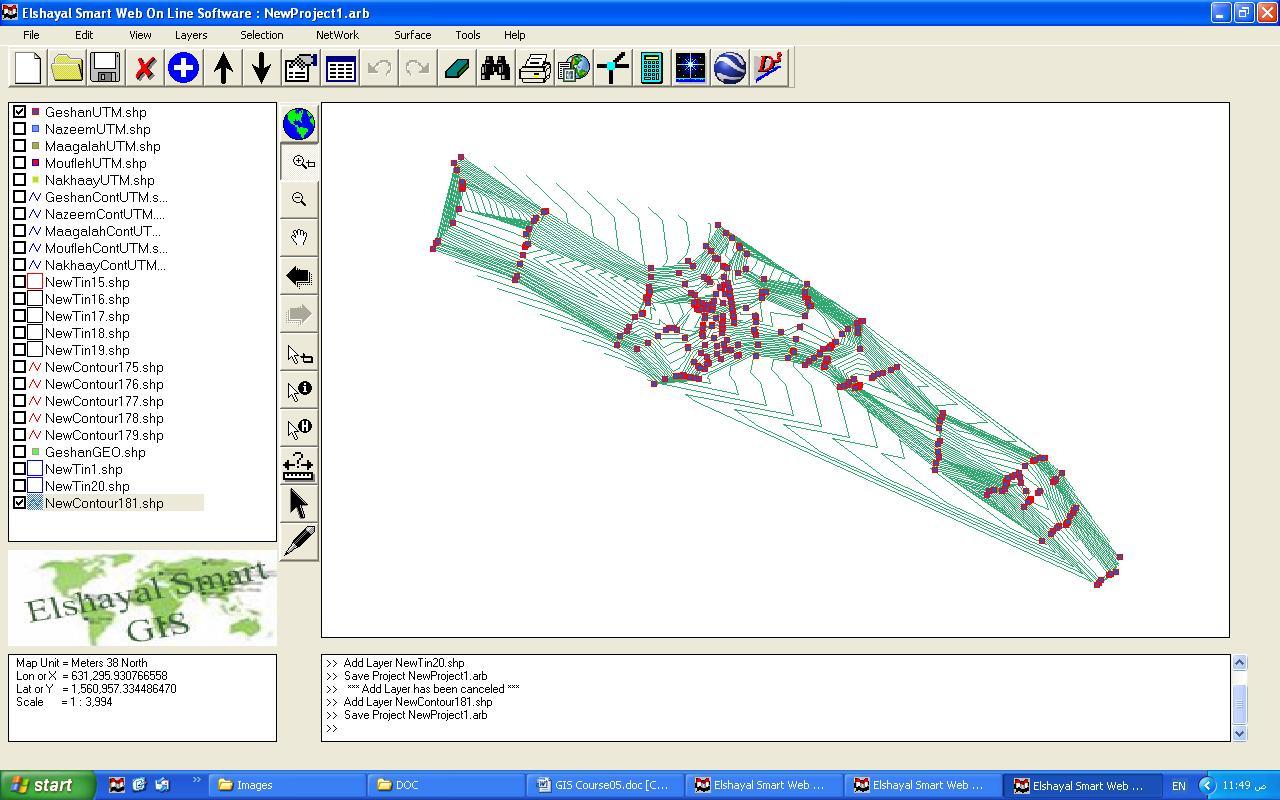
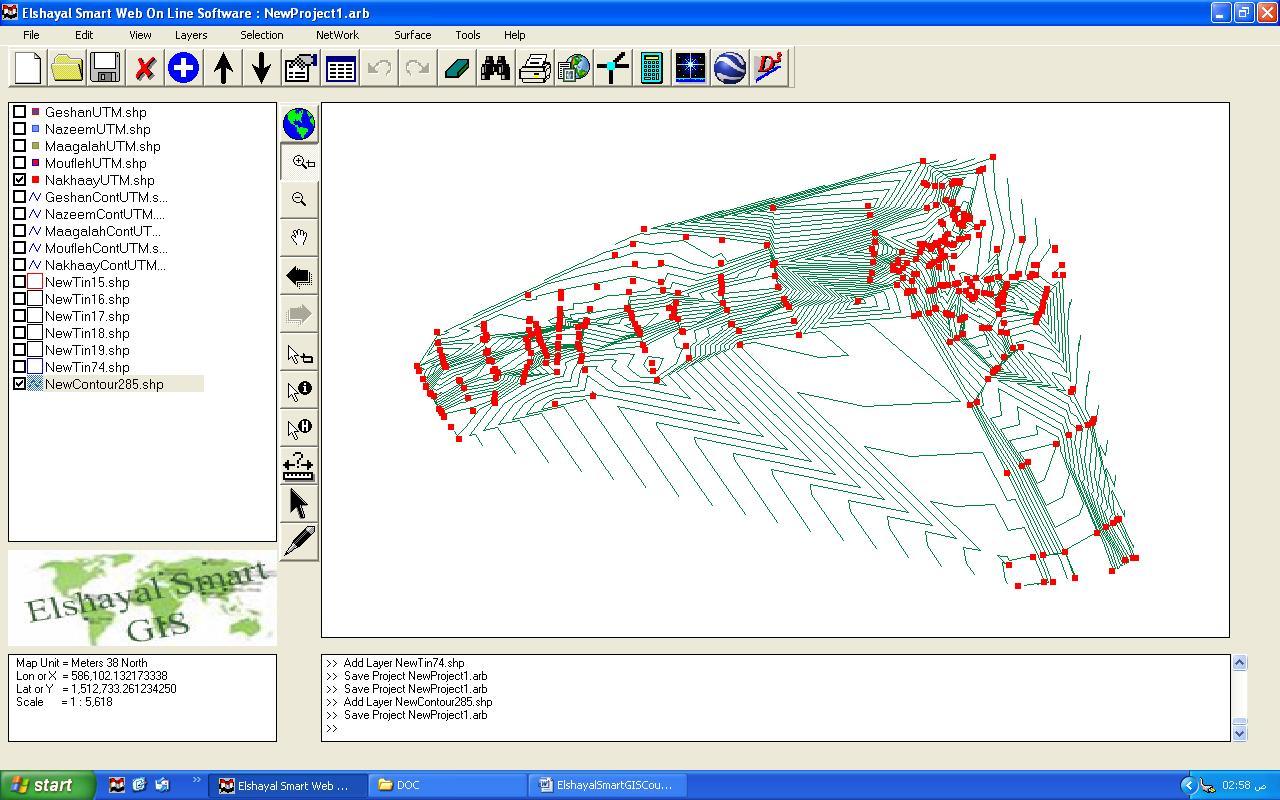
F) Building Contours Surface(s) Analysis
Building Contours Surface(s) Analysis
Menu → Surface → Building Contours Surface(s) Analysis
Check Use Height Layer as Tin Surface or Not
Select Height Layer Name
Select Height Criteria (All Feature or Inside Selected Features or Outside Selected Features)
Select Height Field
Select Contour Interval
Select Base Contour
Select Output Contour Shape file name
Select Build Surface by Delaunay, if elevation points have unequal distances among them.
Select Build Surface by Matrix, if elevation points have equal distances among them.
Select Do not build Surface, if Height layer is a Tin Surface
Press Build
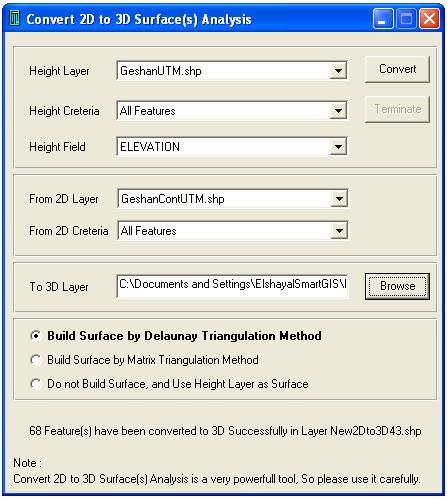
G) Converting 2D to 3D Surface Analysis
Converting 2D to 3D Surface Analysis
Menu → Surface → Converting 2D to 3D Surface Analysis
Check Use Height Layer as Tin Surface or Not
Select Height Layer Name
Select Height Criteria (All Feature or Inside Selected Features or Outside Selected Features)
Select Height Field
Select Destination 2D GIS Shape File
Select Criteria of the Destination 2D GIS Shape File
Select Output 3D Shape file name
Select Build Surface by Delaunay, if elevation points have unequal distances among them.
Select Build Surface by Matrix, if elevation points have equal distances among them.
Select Do not build Surface, if Height layer is a Tin Surface
Press Convert
H) Calculating Area and Volume of Surface(s)
Calculate Area and Volume of Surface(s)
Menu → Surface → Calculate Area and Volume of Surface(s)
Check Use Height Layer as Tin Surface or Not
Select Height Layer Name
Select Height Criteria (All Feature or Inside Selected Features or Outside Selected Features)
Select Height Field
Select Height of the Calculating Plane
Select above Plane or Below Plane
Select Build Surface by Delaunay, if elevation points have unequal distances among them.
Select Build Surface by Matrix, if elevation points have equal distances among them.
Select Do not build Surface, if Height layer is a Tin Surface
Press Calculate
8) GIS Misalliance Tools
A) Converting AutoCAD files to GIS Shape Files
Converting AutoCAD file to Shape Files
Menu → Tools → Converting AutoCAD file to Shape File
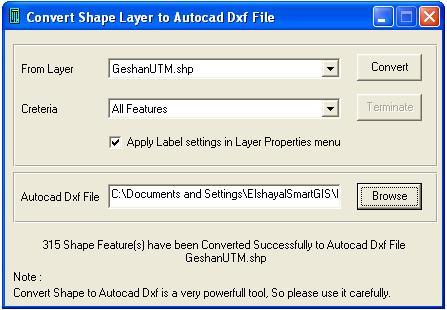
B) Converting GIS Shape Files to AutoCAD files
Converting Shape File to AutoCAD file
Menu → Tools → Converting Shape File to AutoCAD file
C) Converting GIS Shape Files to Google KML files
Converting Shape File to Google KML file
Menu → Tools → Converting Shape File to Google KML file
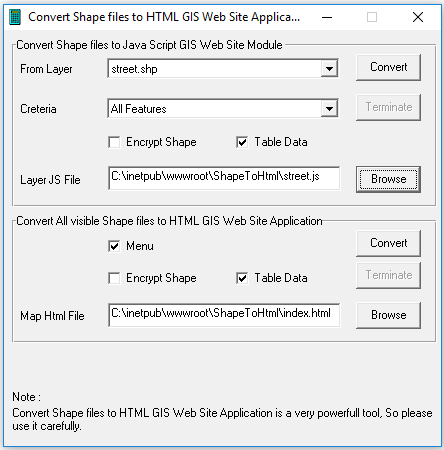
D) Converting GIS Shape Files to HTML GIS Web Sites
Converting GIS Shape File to HTML GIS Web Sites
Menu → Tools → Converting GIS Shape File to HTML GIS Web Sites

 E) Synchronize Google Earth with Lon Lat Geographic maps
Synchronize Google Earth with Lon Lat Geographic Maps
Menu → Tools → Synchronize Google Earth with Lon Lat Geographic Maps
Settings
Open Google Earth 4.3 or Later Versions ( It must be installed in your Computer )
Inside Google Earth, do the following Settings
Tools → Options : Turn Off Terrain
Be Sure that North Arrow is completely very up by
Be Sure that Google Earth is very Flat by:
Close Google Earth
Open GIS Software
Set Map Projection to Decimal Degree
Be Sure Google Earth Software is NOT maximized and is NOT Full Screen
9) Training ( Building A GIS project )
A) Determine a Specific Small Working Area or City
B) Downloading Satellite Images of the Working Area
C) Building Roads and Building shape Files Layers
D) Digitizing the Working Area Roads and Building layers
E) Entering the Available Attribute Data of the Digitized Layers
F) Spatial and Attribute Data Analysis of the Digitized Layers
G) Downloading ASTER DEM NASA Height File of the Working Area
H) Surface Analysis of the Working Area
I) Converting Digitized GIS Layers to AutoCAD.
J) Save Images of the Produced Map (Project Gallery)
K) Converting Digitized GIS Layers to HTML Google Map Web Site.